#MARKETS & INVESTING
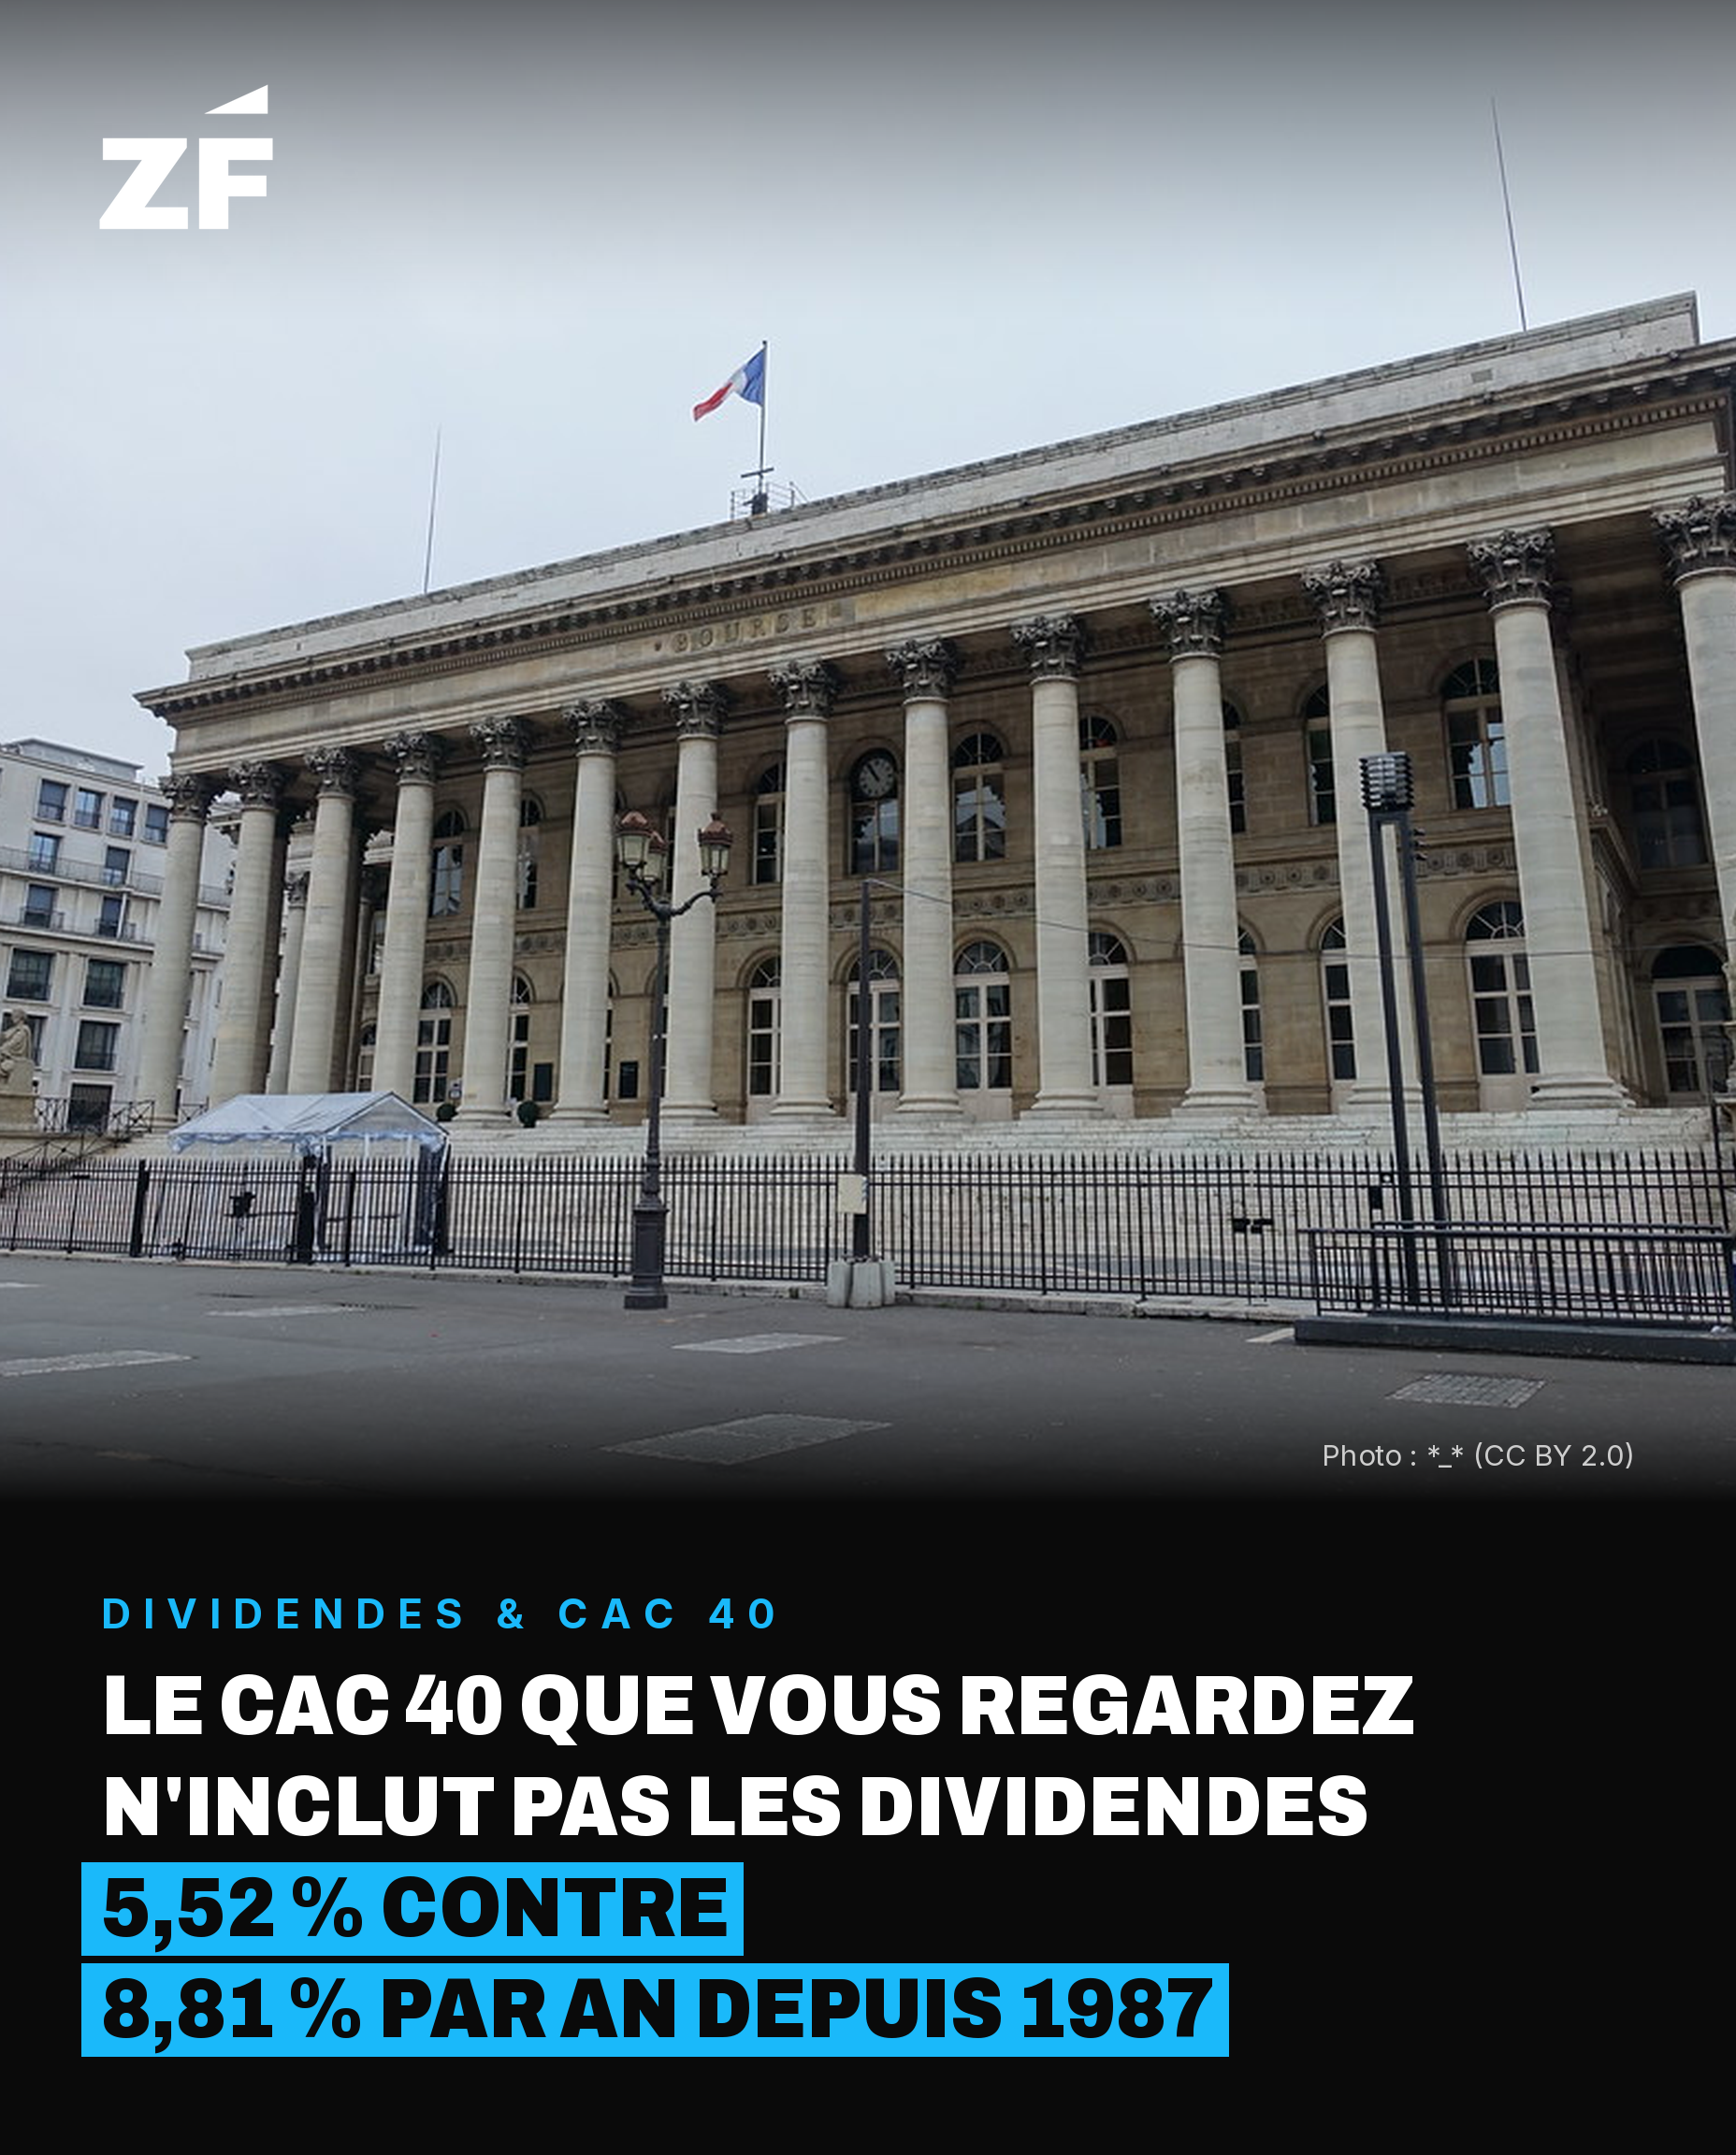
The CAC 40 index the news quotes every evening doesn't count the dividends paid by its companies.
Published on August 17, 2026 · to be rechecked on April 1, 2027
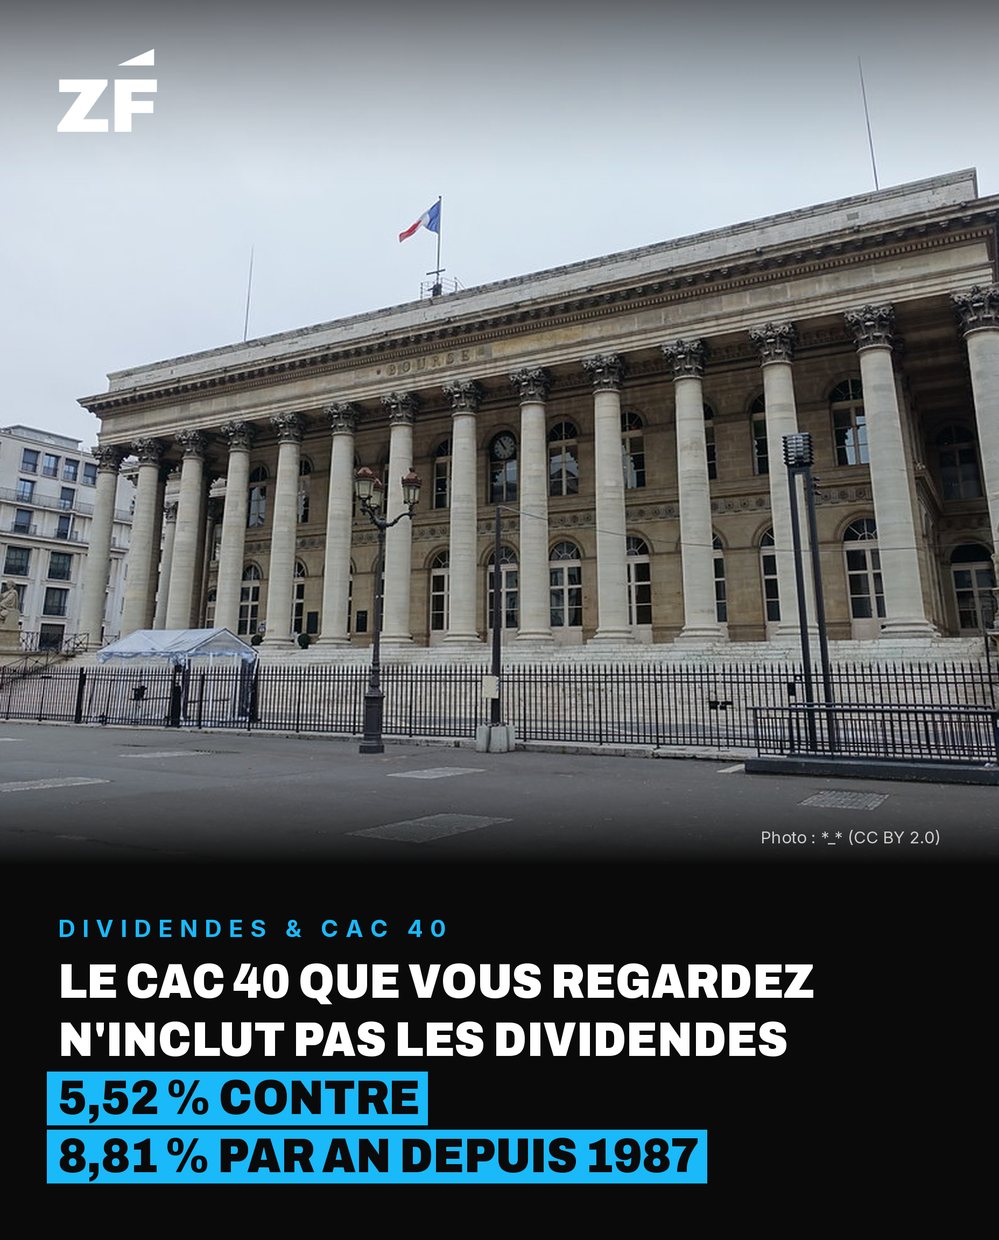
The CAC 40 is a price index: it tracks the value of the 40 largest companies on Euronext Paris, but ignores dividends paid out. Every dividend payment mechanically lowers the share price by the amount distributed — Euronext's own adjustment rule. Since the index's creation in 1987, the gap is substantial: according to Euronext's official factsheet (March 31, 2026), the CAC 40 shows 5.52% annualized, versus 8.81% for the CAC 40 GR, which reinvests dividends.
Over forty years, how big is the cumulative gap?
At 5.52% annualized over 38 years (1987-2026), €10,000 becomes about €78,000. At the CAC 40 GR rate of 8.81%, the same sum reaches about €253,000 — more than three times as much.
In other words: the CAC 40 figure quoted every evening isn't the return of a shareholder who reinvested dividends: it's a partial measure of the French equity market.
Three caveats, because they matter
- The CAC 40 GR assumes immediate reinvestment of dividends, with no fees or taxes — a textbook case, not the situation of a real saver.
- There's also a CAC 40 NR (Net Return), which simulates a 25% tax withholding: its performance sits between that of the CAC 40 and the CAC 40 GR.
- The gap between the two indices varies each year with the dividend yield distributed, itself tied to companies' results.
Why it still matters: following only the CAC 40 structurally understates the long-term return. ETFs or funds with “NR” or “GR” in their name don't suffer from this bias.
For you
- Does the investment you track report performance with or without dividends?
- For a gap of 3 points a year, how many years do you plan to stay invested?
Source: Euronext, official CAC 40 index factsheet, data as of March 31, 2026 (annualized performance since December 31, 1987).
View the source →