
← All the news
Markets & investing
35 articles, each with its source and caveats.

 "ETFs are still a niche product in France." In 2025, 1.1 million French retail investors bought or sold at least one, against 223,000 in 2020.1.1 million the number of French retail investors who traded an ETF at least once in 2025
 Of 212 French equity funds counted at the end of 2015, 60.38% were still alive at the end of 2025. The other four in ten were merged or liquidated, and appear in no ten-year league table.60.38% the share of French equity funds still alive after ten years, out of 212 counted at the end of 2015 (S&P Dow Jones Indices, data to 31 December 2025)
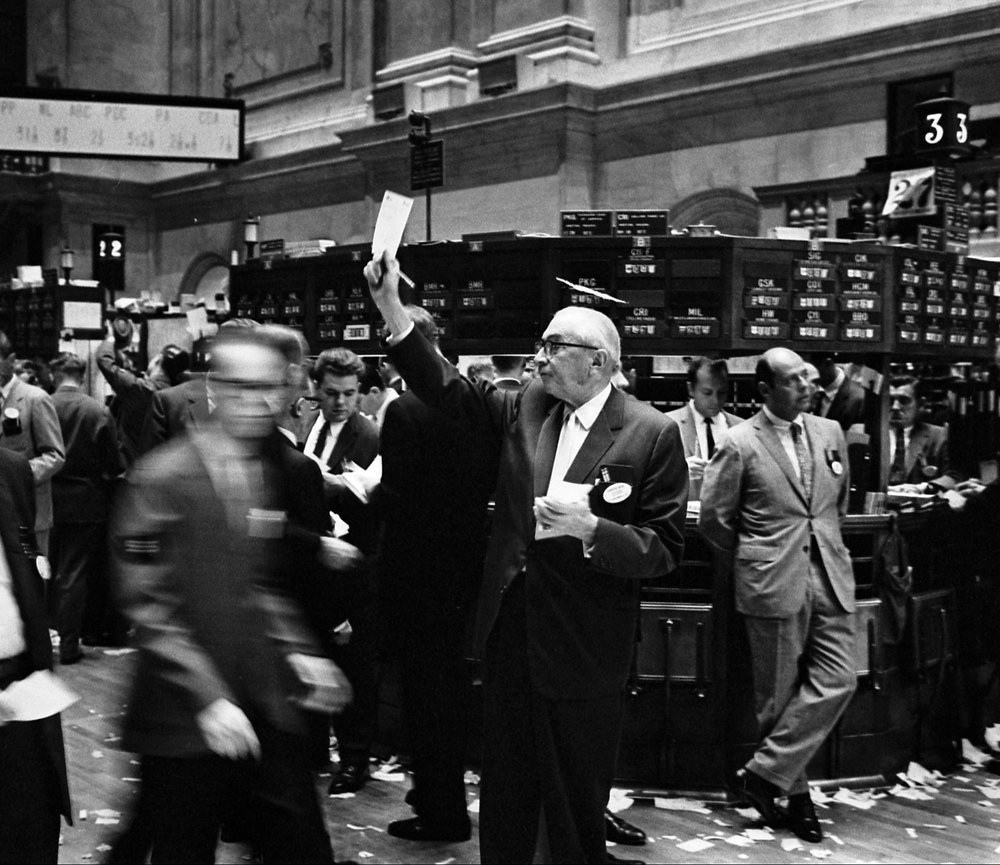 The tenth of US stocks that rose most over twelve months has returned 17.04% a year since 1927. The tenth that fell most has returned −0.97%. Intuition says buy what has dropped; a century of data says the opposite.+17.04% vs −0.97% annual return of the most and least performing deciles of US stocks ranked on the prior twelve months, January 1927 to June 2026
 Sep 3"In wartime the stock market collapses." From September 1939 to August 1945 the US stock market gained 28.3% in real terms, dividends reinvested and inflation removed. Of seven major conflicts since 1914, six ended in a gain.+28.3% — the real total return of the US stock market between September 1939 and August 1945, dividends reinvested and inflation removed, measured on the S&P Composite index in Robert J. Shiller's series
 Sep 3"The market is expensive, so it will fall." Valuation explains 28% of the spread in ten-year returns — and 4% at one year. The most expensive quintile still returns 5.2% the following year, and ends positive 69% of the time.28% against 4% — the share of the spread in annualised real returns of the US stock market explained by valuation (Shiller's CAPE): 28% at ten years, 4% at one year, on monthly data from January 1881 to September 2024
 Sep 2Since 1871 the US market has been through fifteen declines of at least 20%. Getting back to the previous peak takes 47 months at the median, with dividends reinvested and inflation stripped out. But the record does not belong to 1929: it belongs to 2000, at 153 months.47 months — the median time to recover the previous peak after a decline of at least 20% in the US stock market, in real total return, across the fifteen episodes recorded from January 1871 to September 2024
 Sep 1The third of US stocks paying the highest dividend yield returned 11.32% a year from July 1927 onwards. Those paying no dividend at all: 9.47%. A gap of 1.85 points a year — which vanished after 2000, then reversed.11.32% vs 9.47% — the annualised, dividend-reinvested return of the third of US stocks with the highest dividend yield, against companies paying no dividend, from July 1927 to June 2026, in market-capitalisation-weighted portfolios
 Sep 1Bitcoin's volatility has halved in ten years: 87.9% in 2017, 43.7% over the last twelve months. It is still 3.4 times that of the S&P 500, against 3.7 times on average over the decade.43.7% vs 12.8% — the annualised volatility of daily returns for bitcoin and the S&P 500, from 1 September 2025 to 31 August 2026, computed only on days when both markets trade
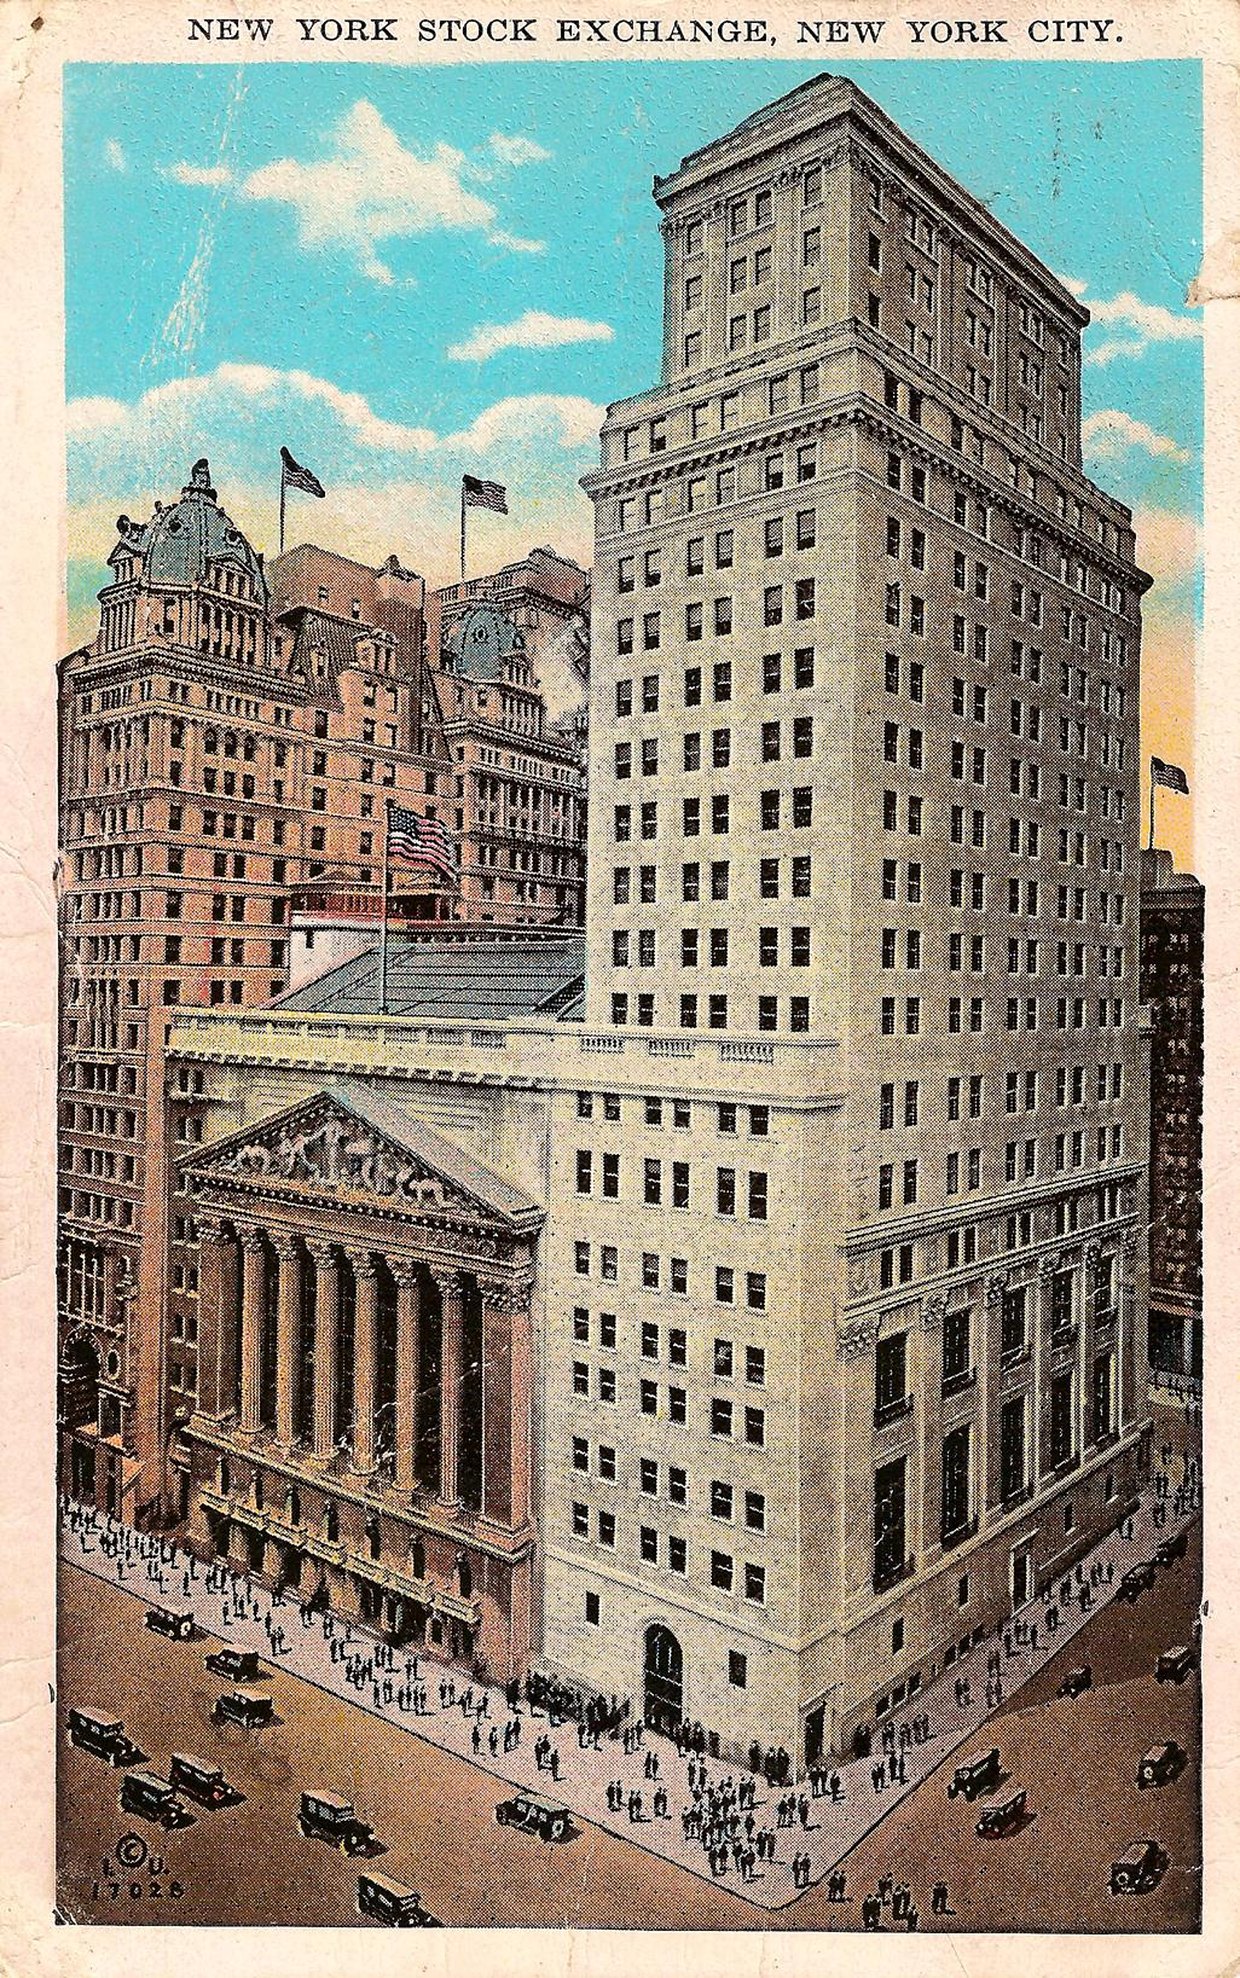 Aug 30The 1929 crash is said to have taken twenty-five years to erase. That is true of the Dow Jones price alone. Reinvest dividends and adjust for deflation, and the starting point was back within seven years.25 years, or 7 years — the time the US market took to recover its September 1929 level, depending on whether you look at the nominal Dow Jones price (November 1954) or the real total return of the S&P Composite, dividends reinvested and prices deflated (November 1936)
 Aug 27Share buybacks delivered 12.1% in abnormal returns over four years in the founding 1995 study. Correct for correlation across firms and the effect becomes undetectable.12.1%, then nothing — the average four-year abnormal return measured after open-market repurchase announcements by Ikenberry, Lakonishok and Vermaelen in 1995 — an effect that does not survive the methodological correction published by Mitchell and Stafford in 2000
 Aug 27Between 1927 and 2015, the excess return on US equities averaged 10.7% a year under Democratic presidents, against −0.2% under Republican ones.+10.7% vs −0.2% — the average annual excess return on the US stock market under Democratic presidents, against −0.2% under Republican presidents, measured over 1927-2015
 Aug 26The Cambridge Centre for Alternative Finance puts the bitcoin network's annual electricity use at 138 TWh, or roughly 0.5% of world electricity consumption.138 TWh, 0.5% — the annual electricity consumption of bitcoin mining estimated by the Cambridge Centre for Alternative Finance, about 0.5% of global electricity use
 Aug 25The IMF measured how closely daily bitcoin moves track the S&P 500: a correlation of 0.01 over 2017-19, and 0.36 over 2020-21.0.01, then 0.36 — the correlation between daily bitcoin returns and daily S&P 500 returns as measured by the IMF: 0.01 over 2017-19, 0.36 over 2020-21
 Aug 25McLean and Pontiff replayed 97 signals said to predict stock returns. Once the study documenting them is published, their return falls by 58%.−58% — the average drop in the return of 97 US stock market anomalies after the academic publication that documents them, relative to the return measured in the original sample (McLean and Pontiff, Journal of Finance, 2016)
 Aug 24French households are said to be afraid of the stock market, unlike their neighbours. In the euro area's financial accounts, the share of listed shares in their financial wealth is the European average, to within a tenth of a point.4.5% versus 4.6% — the share of directly held listed shares in household financial assets at end-2024: 4.5% in France, 4.6% across the 20-country euro area
 Aug 23'The stock market is a casino' comes up every time markets fall. The two actually run on opposite mechanics — written into law for one, measured over 125 years for the other.85% cap vs. +6.6%/year — the maximum player return rate legally allowed on slot machines in France (meaning a guaranteed average loss of at least 15% per bet, by construction), versus the average real return of world equities since 1900
 Aug 23A 10% drop in the stock market is treated like a rare, alarming event. Since 1980, it has happened in nearly one year out of two.24 years out of 46 — the number of years, since 1980, in which the S&P 500 suffered a decline of 10% or more from a recent peak, according to independent analyses by Carson Group and LPL Research on the index's data
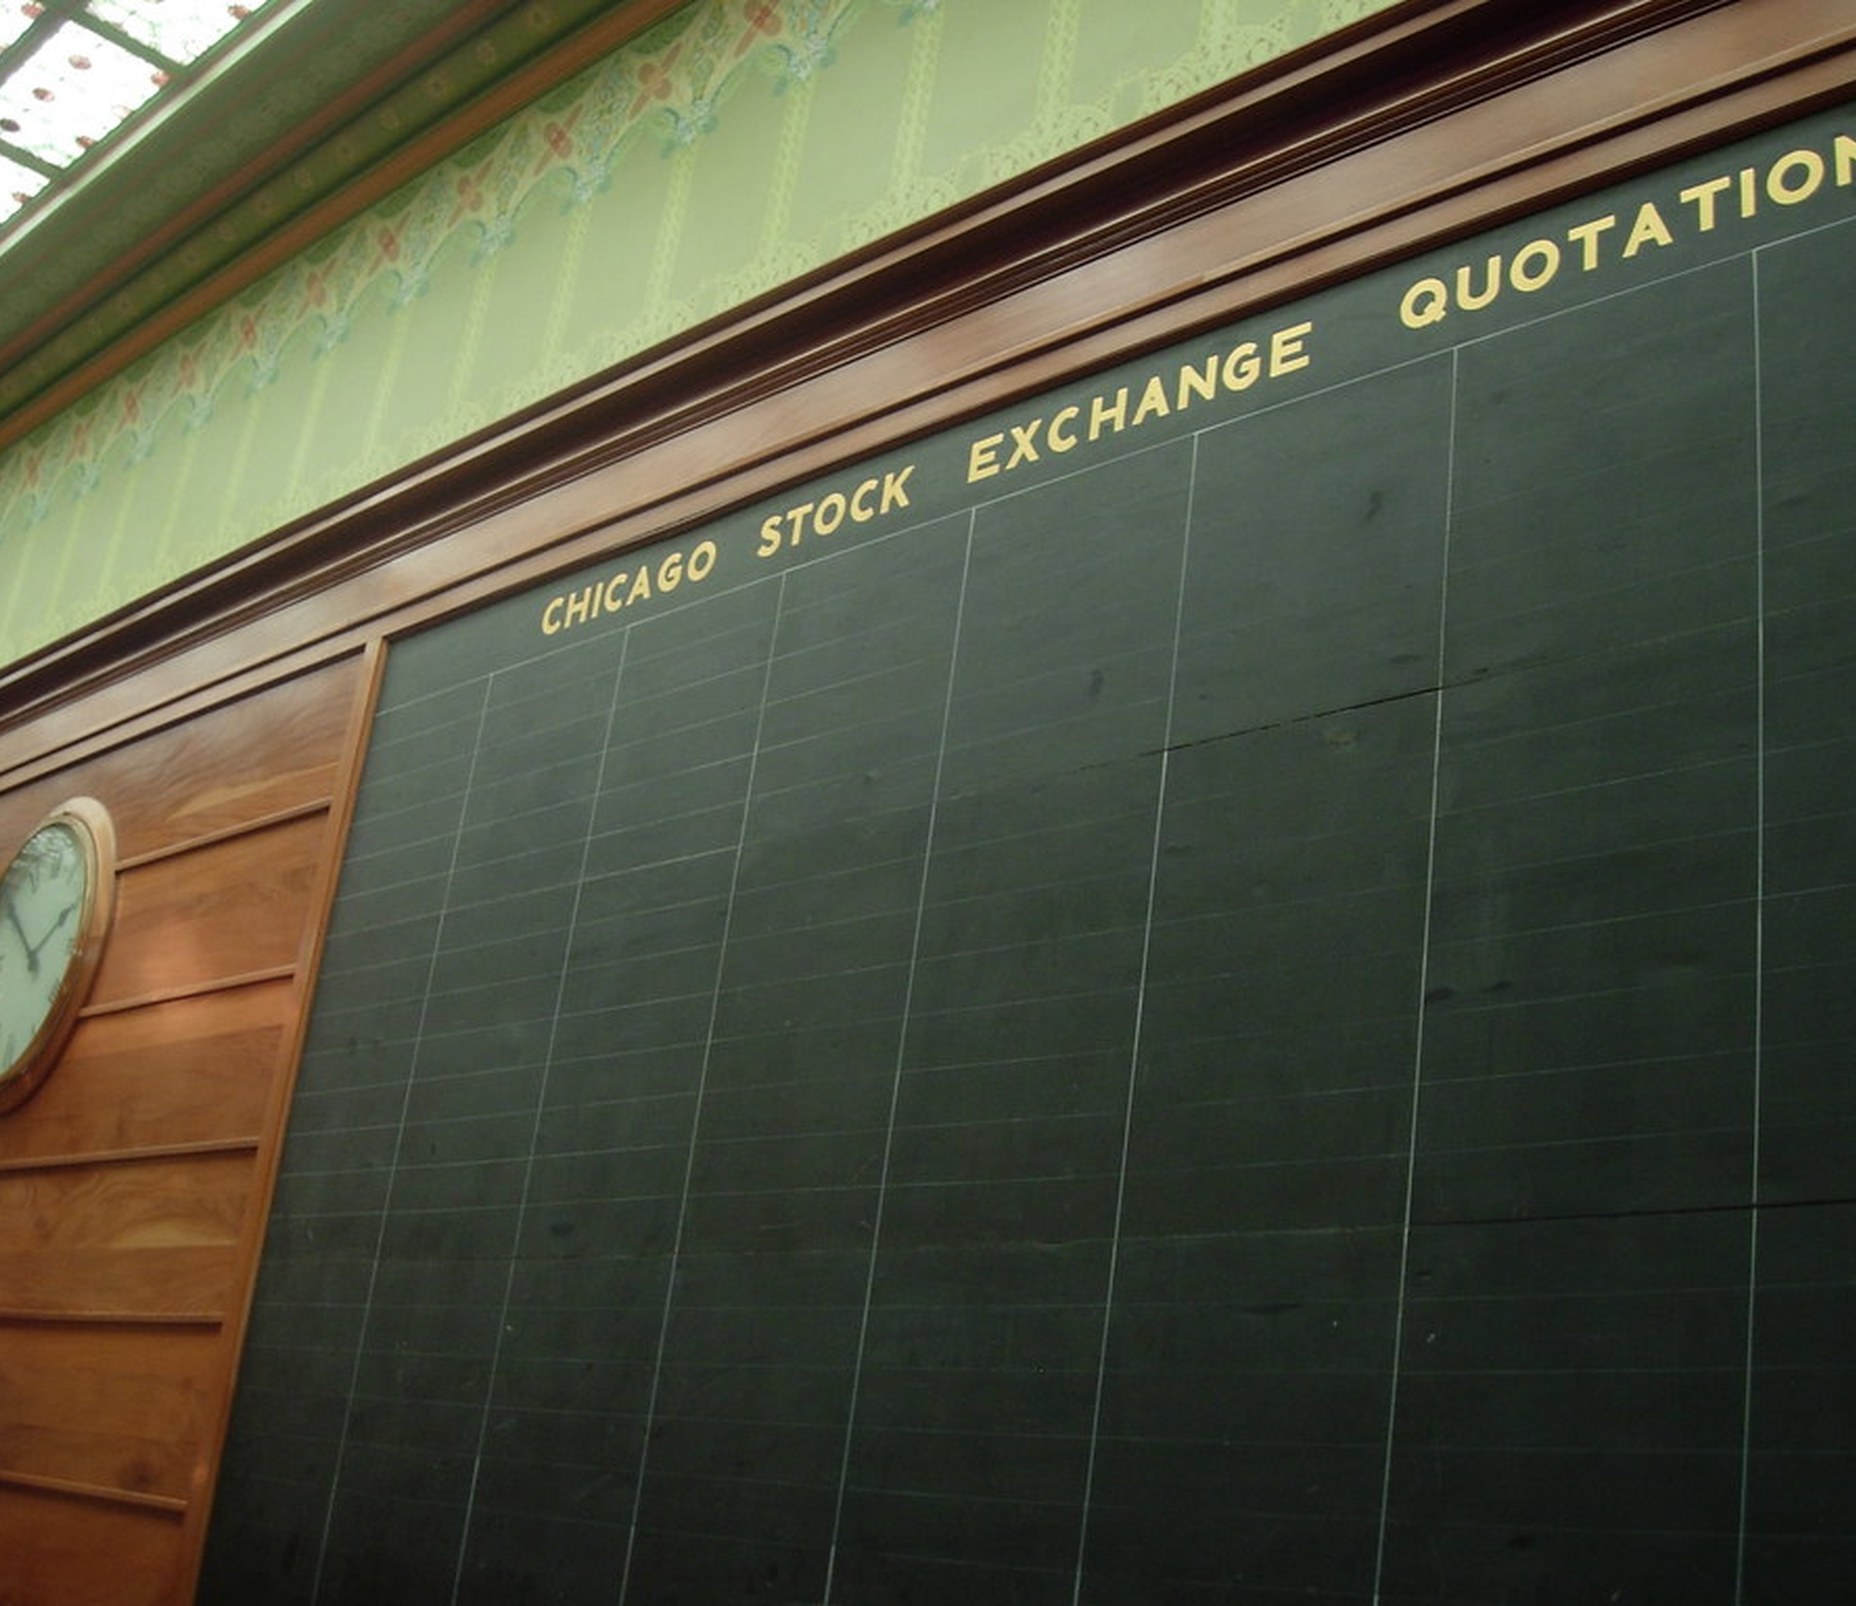 Aug 21We keep hearing that about ten stocks is enough to diversify a portfolio. That rule is over fifty years old, and more recent research considers it badly outdated.10 stocks, then over 100 — the number of stocks judged sufficient to diversify a portfolio according to the founding 1968 study (Evans & Archer), versus the threshold more recent research still considers insufficient (Domian, Louton & Racine, 2007)
 Aug 20We tend to think of France's borrowing rate as a distant, technical number. It just hit its highest level since 2008.4.10% — the rate at which France borrows over 10 years (TEC 10 / OAT index) on August 19, 2026, a level not seen since October 2008, as public debt reaches 117.5% of GDP
 Aug 20A strategy that beats the market for 80 years, then gets beaten by it for 14 straight years: it's the same strategy.+5.9% vs −6.7% — the average annual return of the “value” factor (cheap stocks minus expensive stocks) between 1927 and 2006, versus its average annual return between 2007 and 2020, based on Kenneth French's (Fama-French) data
 Aug 20A company going public makes headlines and pops 19% on day one, on average. Five years later, most investors who followed it have lost money.57% — the share of 9,195 U.S. IPOs from 1975-2021 whose total return, five years later, was negative — measured from the offer price, dividends included
 Aug 19A year before every recession of the last quarter century, economists were forecasting... growth, almost every time.5 out of 153 — the number of recessions correctly anticipated as early as April of the preceding year by economists' consensus forecasts, out of 153 recessions recorded across 63 countries between 1992 and 2014
 Aug 19Is the top-ranked fund of one year more likely to stay on top? The persistence numbers say no.0% — the share of U.S. large-cap equity funds ranked in the top quartile for performance at the end of 2020 that were still in that same quartile every following year, through the end of 2024
 Aug 17The CAC 40 index the news quotes every evening doesn't count the dividends paid by its companies.5.52% vs. 8.81% — the annualized return of the CAC 40 since its creation on December 31, 1987, excluding dividends, versus that of the CAC 40 GR (Gross Return), which reinvests them
 Aug 17The individual investors who trade the most aren't the ones who earn the most — quite the opposite.11.4% vs. 18.5% — the net-of-fees annual return of the 20% of households that trade most actively, versus that of the 20% that trade least (a buy-and-hold strategy), on U.S. brokerage accounts, 1991-1996
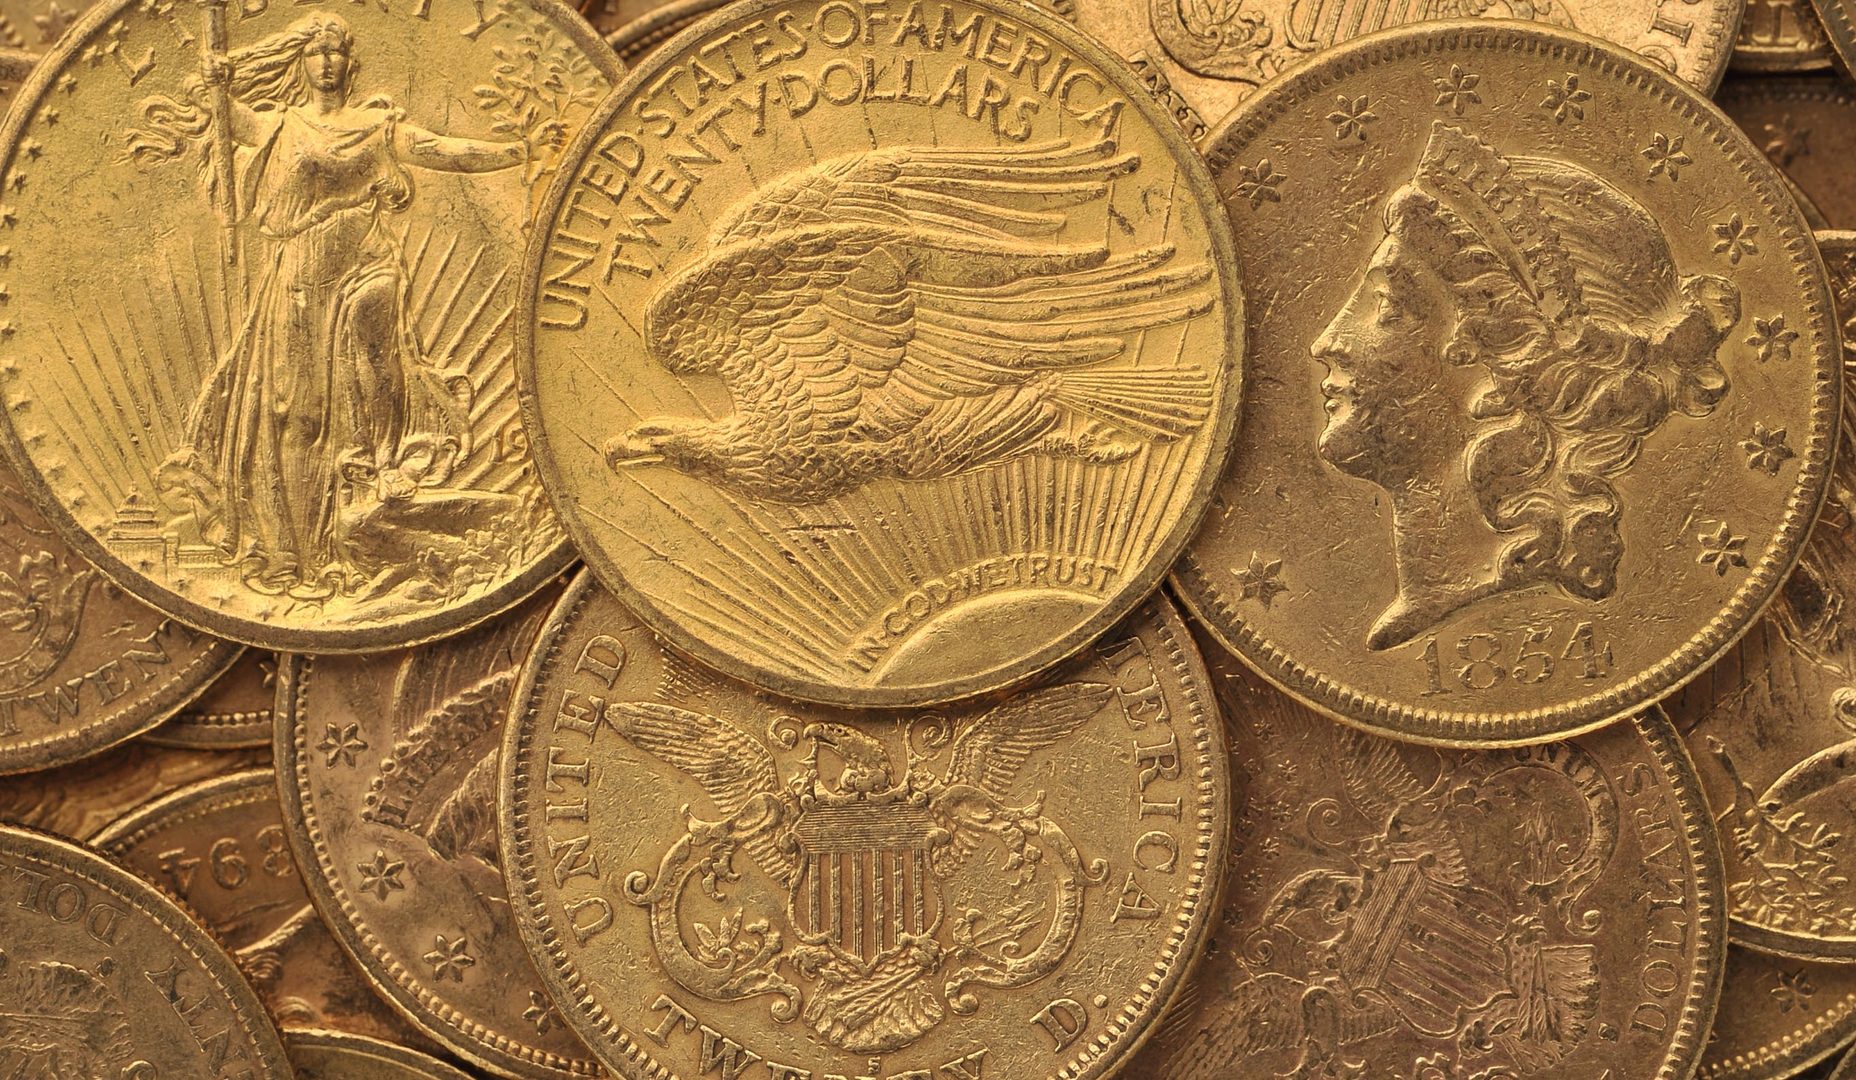 Aug 12Gold barely protects against inflation. Since 1900 it has returned 1.3% a year after inflation — five times less than stocks.1.3% vs. 6.6% — real annual return of gold and U.S. stocks since 1900, after inflation
 Aug 12Of 1,551 individuals who kept day trading for more than 300 sessions, 97% lost money.97% — of individuals who kept day trading for more than 300 sessions lost money, net of fees
 Aug 11The average U.S. stock's lifetime return exceeds 30,000%. The median return is negative. Both figures are correct.+30,000% vs. −6.9% — average and median lifetime return of a U.S. stock over its entire time listed, between 1926 and 2025
 Aug 10The four cloud giants will spend more this year than the GDP of most countries. Without yet knowing what it will deliver.≈ $700 billion — combined capital expenditure in 2026 for Alphabet, Amazon, Meta and Microsoft
 Aug 11Stepping out of the market “just until it blows over” has cost more than every crisis it was meant to avoid.$80,619 vs. $35,866 — $10,000 invested in the S&P 500 for twenty years, staying fully invested versus missing the ten best trading days
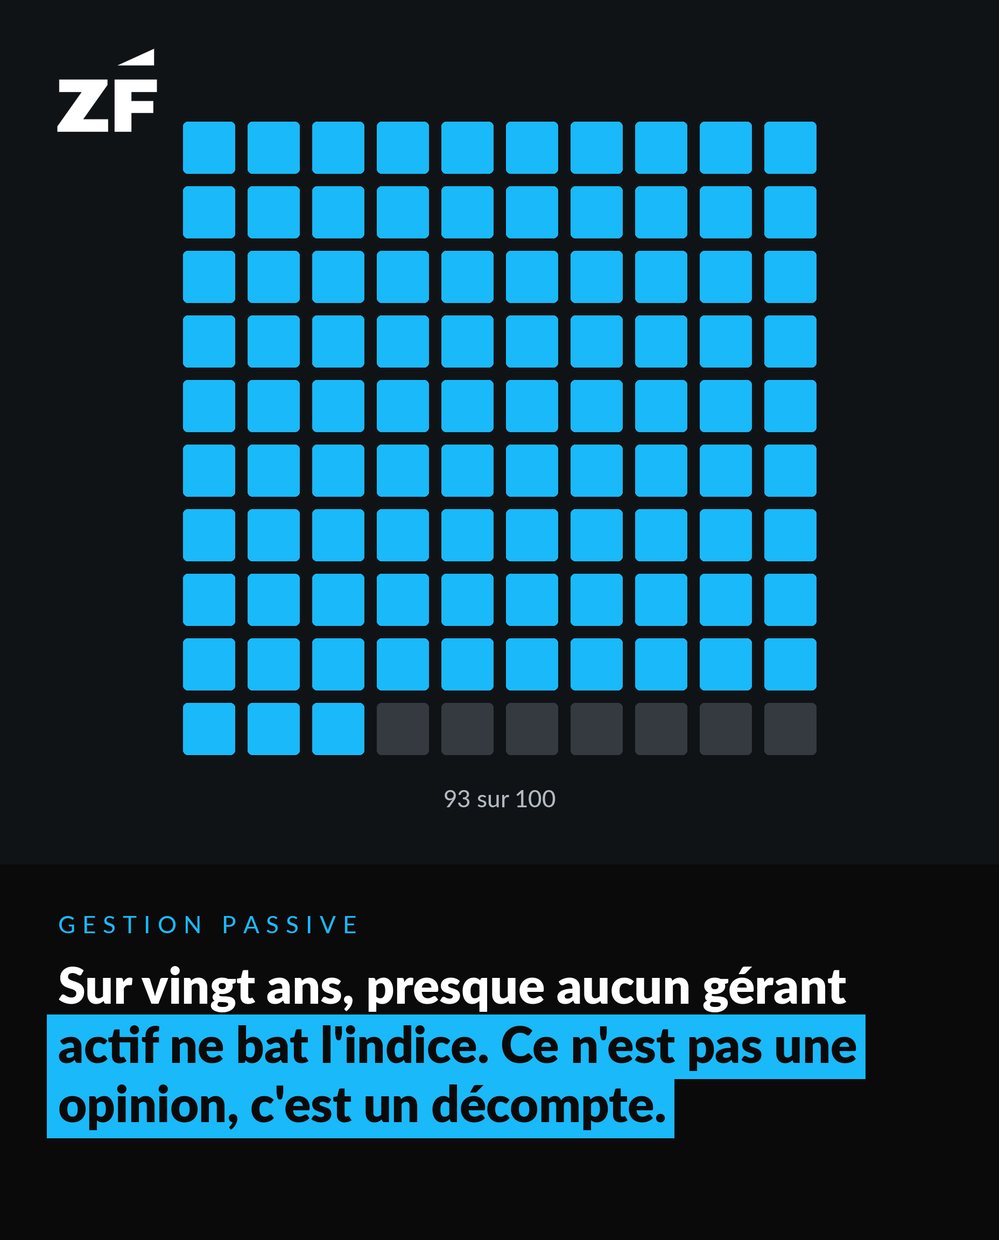 Aug 6Over twenty years, almost no active manager beats the index. This isn't an opinion, it's a tally.92.89% — of actively managed U.S. large-cap equity funds were beaten by the S&P 500 over twenty years