#MARKETS & INVESTING
The individual investors who trade the most aren't the ones who earn the most — quite the opposite.
Published on August 17, 2026 · to be rechecked on January 1, 2028
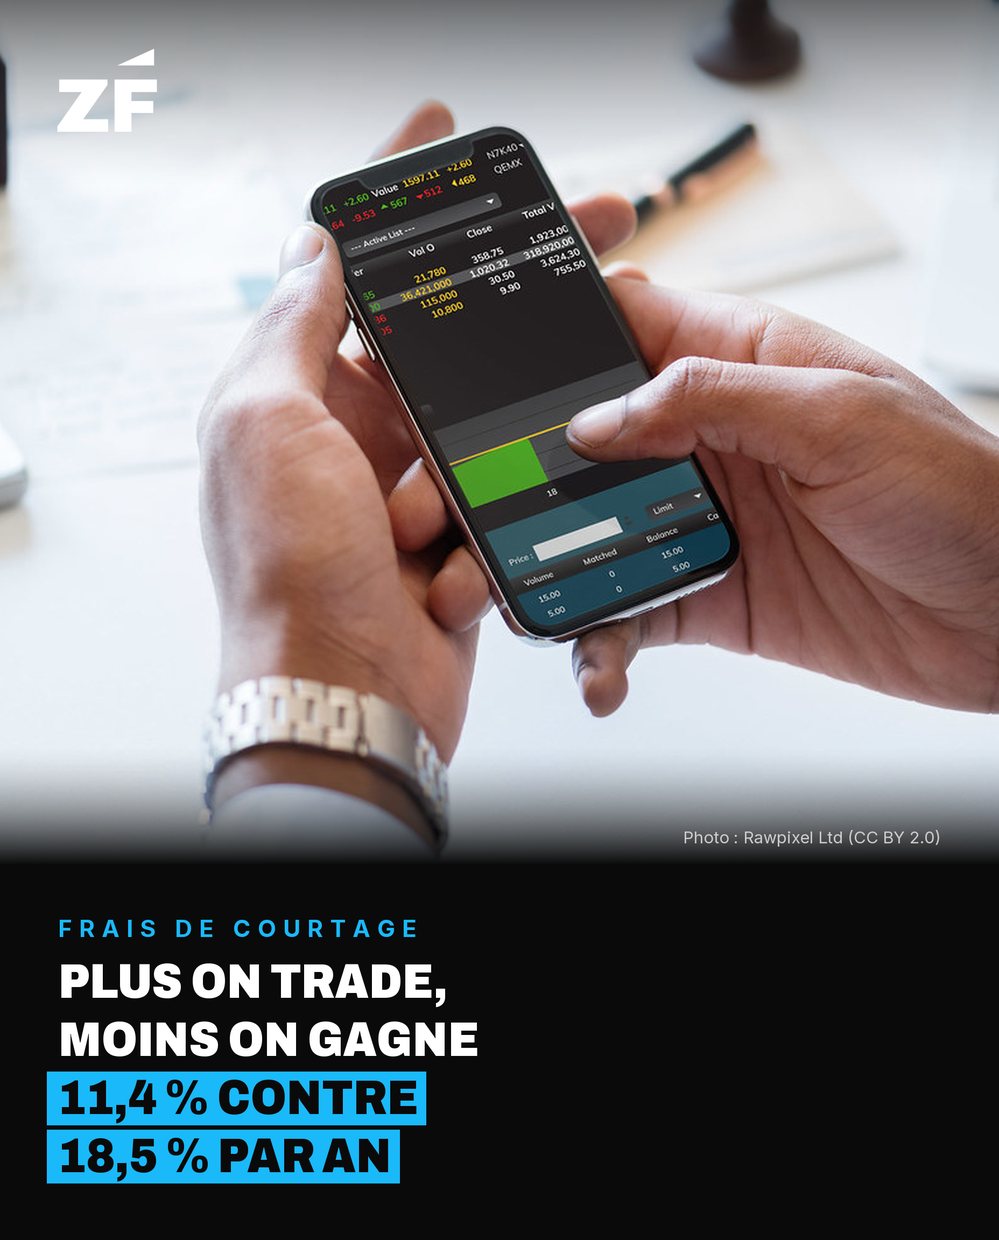
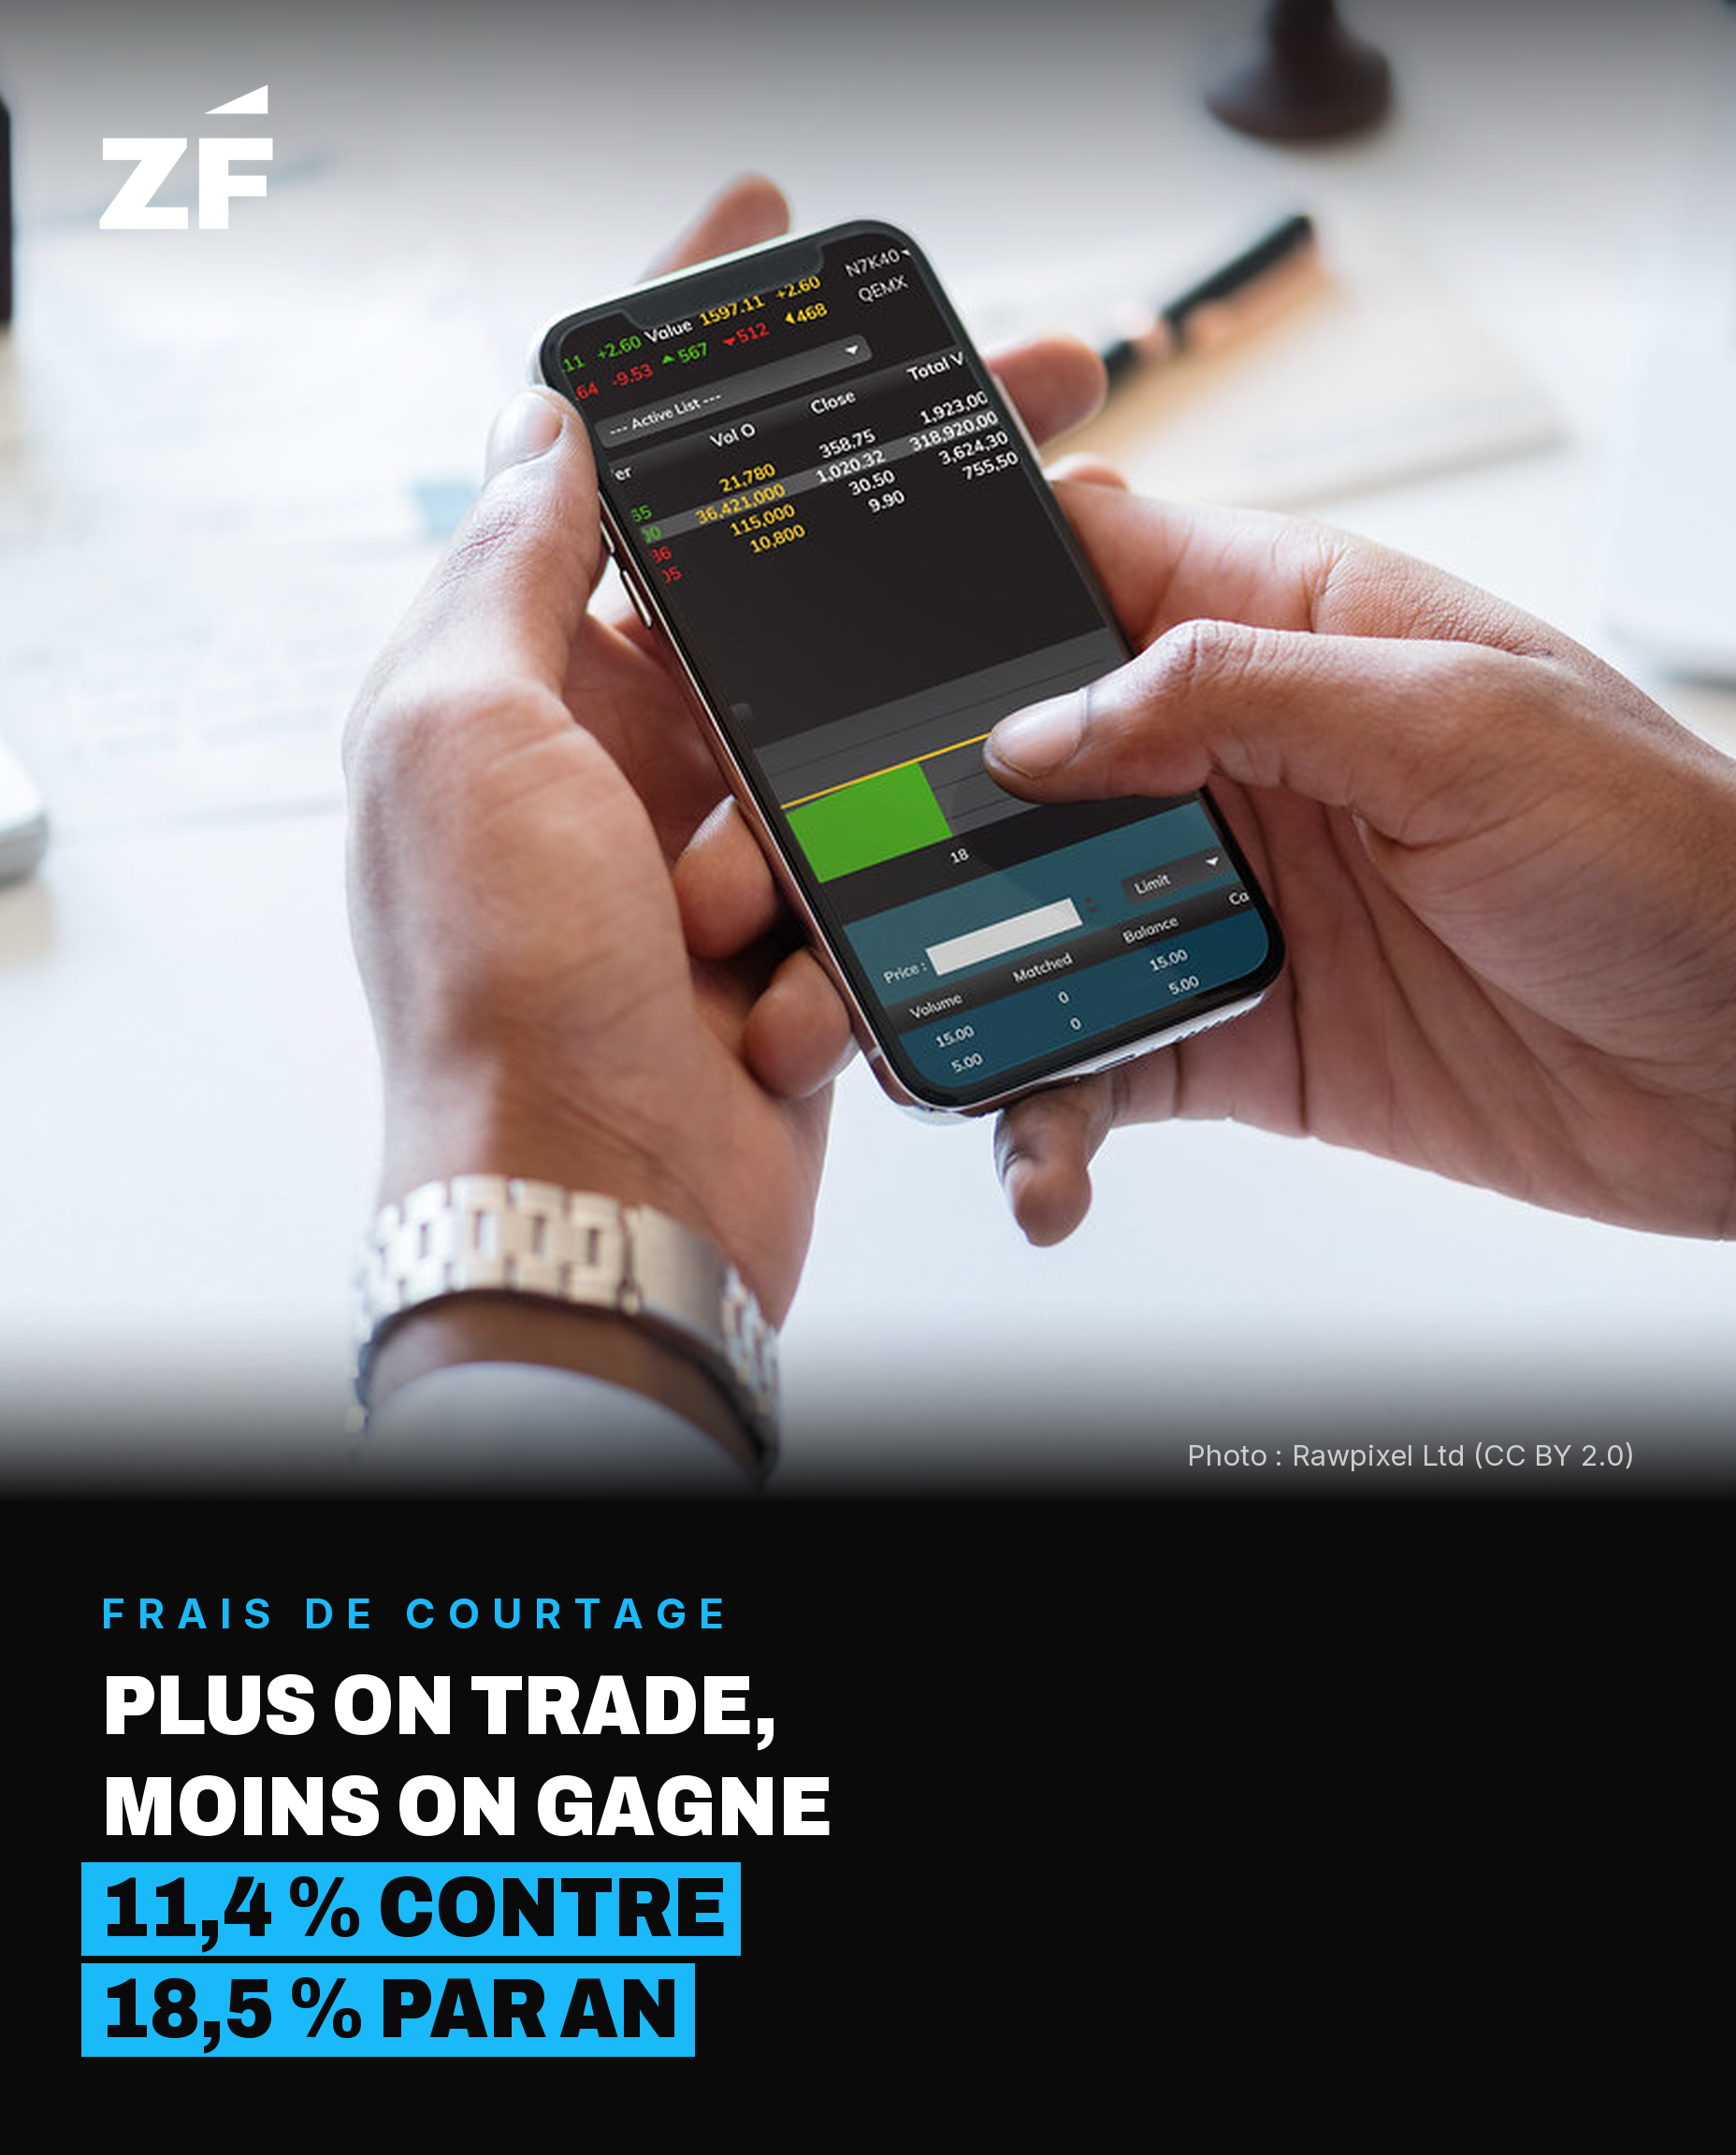
Barber and Odean sorted about 65,000 households at a large U.S. broker into five groups by portfolio turnover, between 1991 and 1996. The most active 20% show a net-of-fees annual return of 11.4%, versus 18.5% for the least active 20% — close to simple “buy and hold.” The gap, 7 points a year, is described by the authors themselves as “economically large.”
How fast do the most active traders turn over their portfolio?
The most active quintile turns over its portfolio by 258% a year — more than twice its entire holdings traded every year.
In other words: it isn't bad luck that explains the gap, it's transaction costs: every purchase and every sale has a price that adds up with frequency.
Three caveats, because they matter
- The study covers U.S. accounts from 1991-1996: brokerage fees have fallen sharply since then, which narrows part of the measured gap.
- Ranking by turnover also captures a behavioral bias: the most active traders are statistically the most prone to overconfidence.
- A higher buy-and-hold return doesn't mean zero fees: the 18.5% is still net of costs, simply lower costs.
Why it still matters: trading frequency isn't a sign of diligence: on average, it's a cost that adds up faster than the gains it's meant to capture.
For you
- How many times have you changed your portfolio over the last twelve months?
- Was each of those trades based on new information, or on an impression?
Source: Brad M. Barber and Terrance Odean, “Trading Is Hazardous to Your Wealth: The Common Stock Investment Performance of Individual Investors”, The Journal of Finance, vol. 55, no. 2, 2000; figures reprised by the same authors in “The Behavior of Individual Investors”, Handbook of the Economics of Finance, 2013.
View the source →