#MARKETS & INVESTING
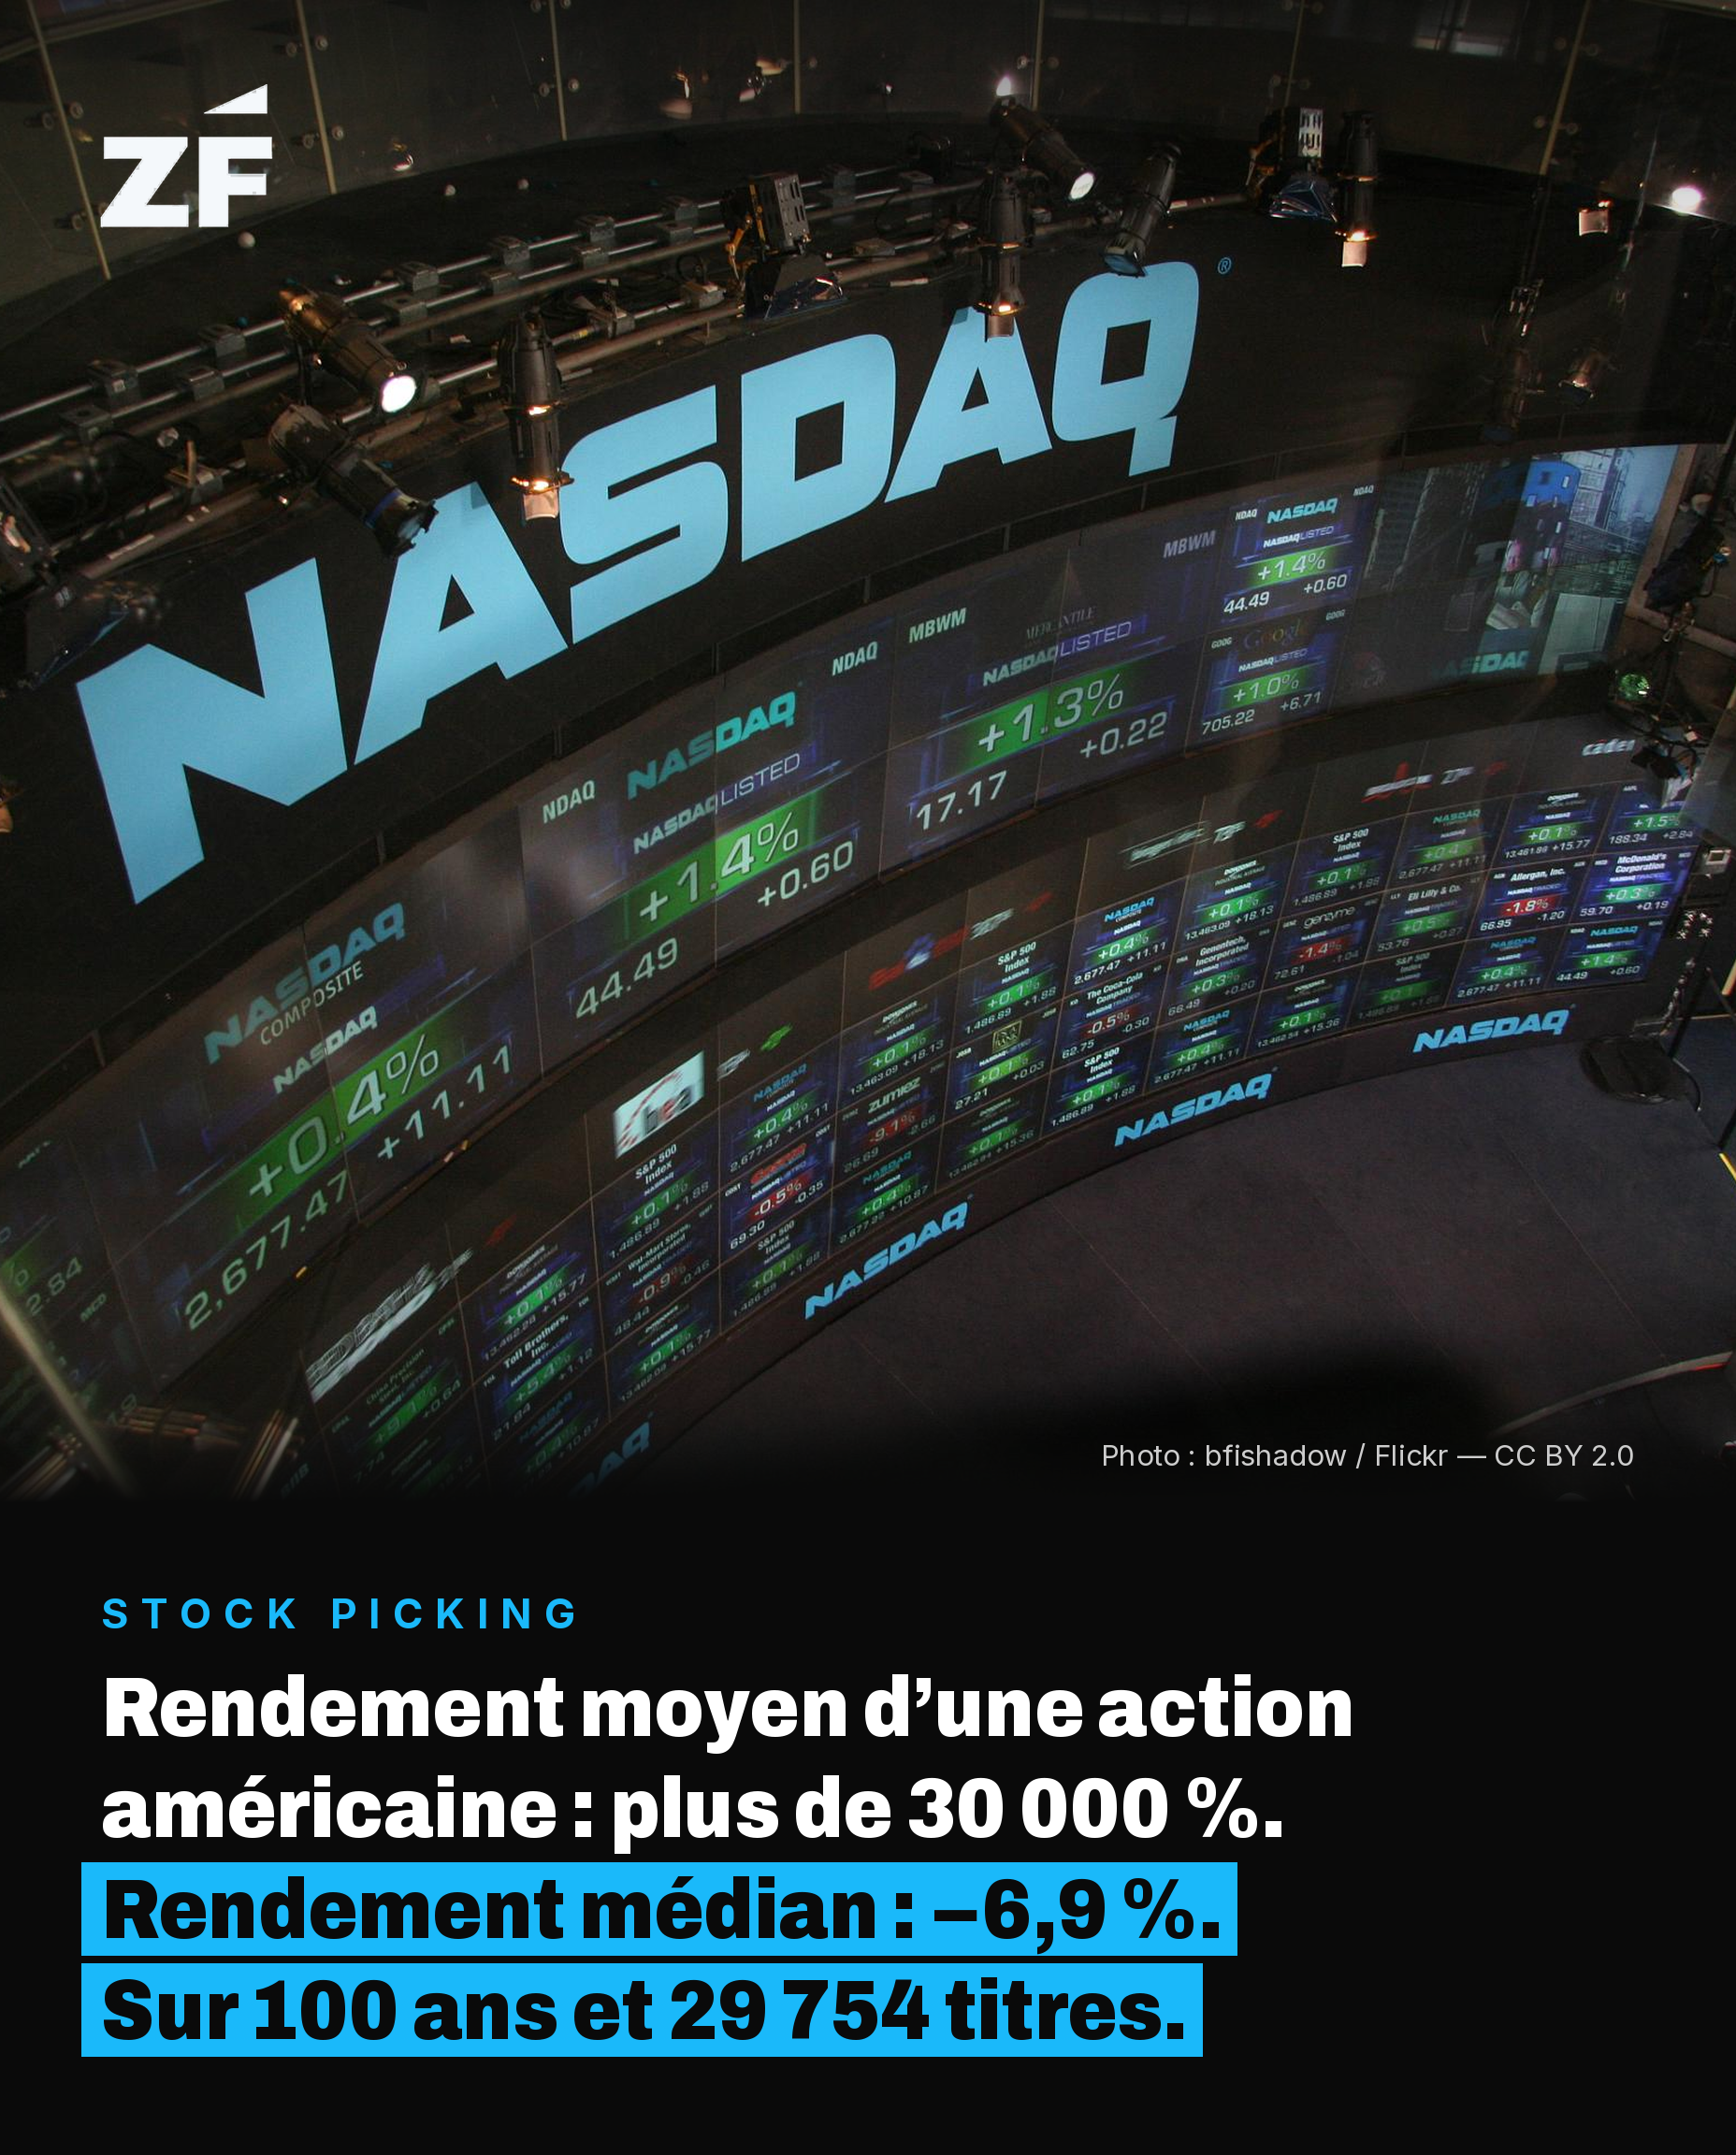
The average U.S. stock's lifetime return exceeds 30,000%. The median return is negative. Both figures are correct.
Published on August 11, 2026
Hendrik Bessembinder, of Arizona State University, tracked the complete stock-market history of 29,754 U.S. stocks listed between 1926 and 2025, from their listing to their delisting. The average lifetime return of a stock exceeds 30,000%. The median return, meanwhile, comes out at −6.9%. Published in 2026 under the title “One Hundred Years in the U.S. Stock Markets.”
How can both figures coexist?
Because the distribution is extremely skewed. Nearly 60% of stocks reduced their long-term shareholders' wealth, while a handful created trillions of dollars of it.
In other words: the “average” stock doesn't exist. Picked at random, a U.S. stock has better than even odds of losing money over its listed lifetime.
Three caveats, because they matter
- The return is measured over each stock's time listed, which ranges from a few months to a century. It isn't an annualized return and doesn't compare directly to an index's performance.
- The study covers the U.S. market from 1926 to 2025. This skew shows up elsewhere too; its exact size depends on the market.
- This result doesn't say stock picking is impossible. It says it's hard, and that getting it wrong costs more than the average suggests.
Why it still matters: a portfolio of a handful of stocks isn't a concentrated version of the market, it's a bet on the tail of the distribution. Diversification isn't timidity: it's what guarantees you're present in the rare stocks that drive the result.
For you
- How many holdings do you own, and which one will carry your performance over twenty years?
- If you can't answer, should you really be picking at all?
Source: Hendrik Bessembinder, “One Hundred Years in the U.S. Stock Markets”, 2026.
View the source →